Rainfall Climate of Ireland
Rainfall is a key indicator of changes in the climate, measurements and analysis of rainfall are essential for assessing the effects of climate change on the water cycle, water balance and for flood mitigation.
The value of high quality observations to the meteorological and climatological scientific communities cannot be overstated. Historical observations are of particular value since an observation once made in time cannot be retaken, and if observations are not taken we have no way of directly knowing what the past weather and climate were like. The history of organised weather observations in Ireland goes back to the late 1700s with Observatories in Dunsink (1787) and Armagh (1790). In the first half of the 19th century readings were taken at Birr Castle (1845), Markree Castle (1824), the Phoenix Park (1829) and Trinity College, Dublin (1838). From the mid 19th century the number of stations increased and some standardisation of observations took places in line with international developments. By the early 20th century there were over 100 locations measuring rainfall, by the time the Irish Meteorological Service was formed in 1936 the number of rain gauges was over 200. Since then the network has expanded further, there are now just under 500 rain gauge locations in the country.
From these rain gauges, Met Éireann has recorded and stored nearly 9.5 million individual hourly rainfall measurements into the National Climate Database between 1939 and 2017. From this observational dataset, and others, analysis is completed to give details of the Rainfall Climate of Ireland. For example, the general impression is that it rains quite a lot of the time in Ireland, but only one out of five hourly observations will report measurable rainfall. However, there is variation between sites of course, for example at stations on higher ground (that is, highest in counties Kerry and Wicklow), rainfall is recorded every one in 3.5 to 4 hours.
The Rainfall Observational Network
Following the establishment of the Irish Meteorological Service in 1936, the rainfall network was organised and expanded, reaching a peak of approximately 800 rainfall stations in the late 1950s, currently rainfall is measured at approximately 500 locations.
Rainfall is recorded at synoptic and climate stations, in addition there is a wide network of voluntary rainfall observers. At synoptic stations, rainfall readings are made continuously and reported on the hour. At climate and rainfall stations a daily rainfall total is recorded each day at 0900 UTC, the total recorded at this time is assigned to the previous day. There are also a number of rain gauges in remote locations which are read once a month, usually on the first.
Map of the National Synoptic, Climate and Rainfall Stations recording Rainfall (2017)
Irish Stations with over 100 years of rainfall observations
Stations with long term records are crucial for the observation, analysis and quantification of climate change. Amongst Irish stations with a rainfall observational record from the 19th century are Valentia Observatory in Co Kerry and Phoenix Park in Co Dublin. The graph below shows the annual accumulated rainfall series for the long term stations at Valentia Observatory, Co Kerry and at Phoenix Park, Co Dublin.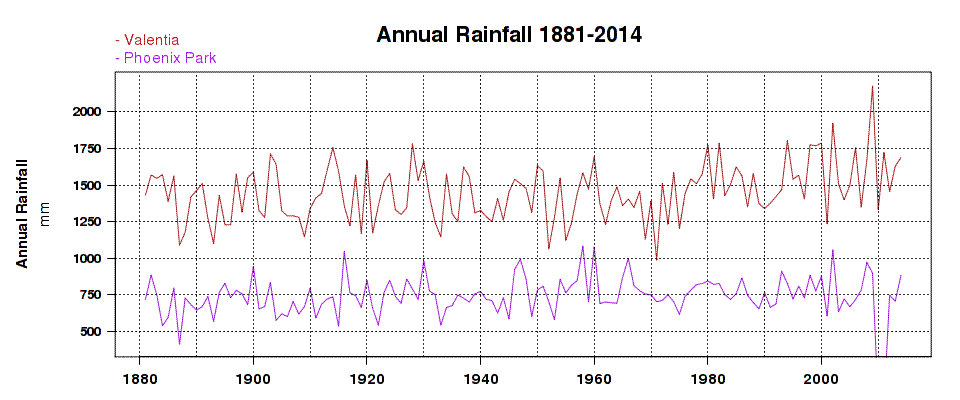

In May 2017, Valentia Observatory was accepted as one of the inaugural centennial worldwide observing stations. YouTube video from the World Meteorological Organization on Centennial Observing Stations Worldwide.
Measuring Rainfall
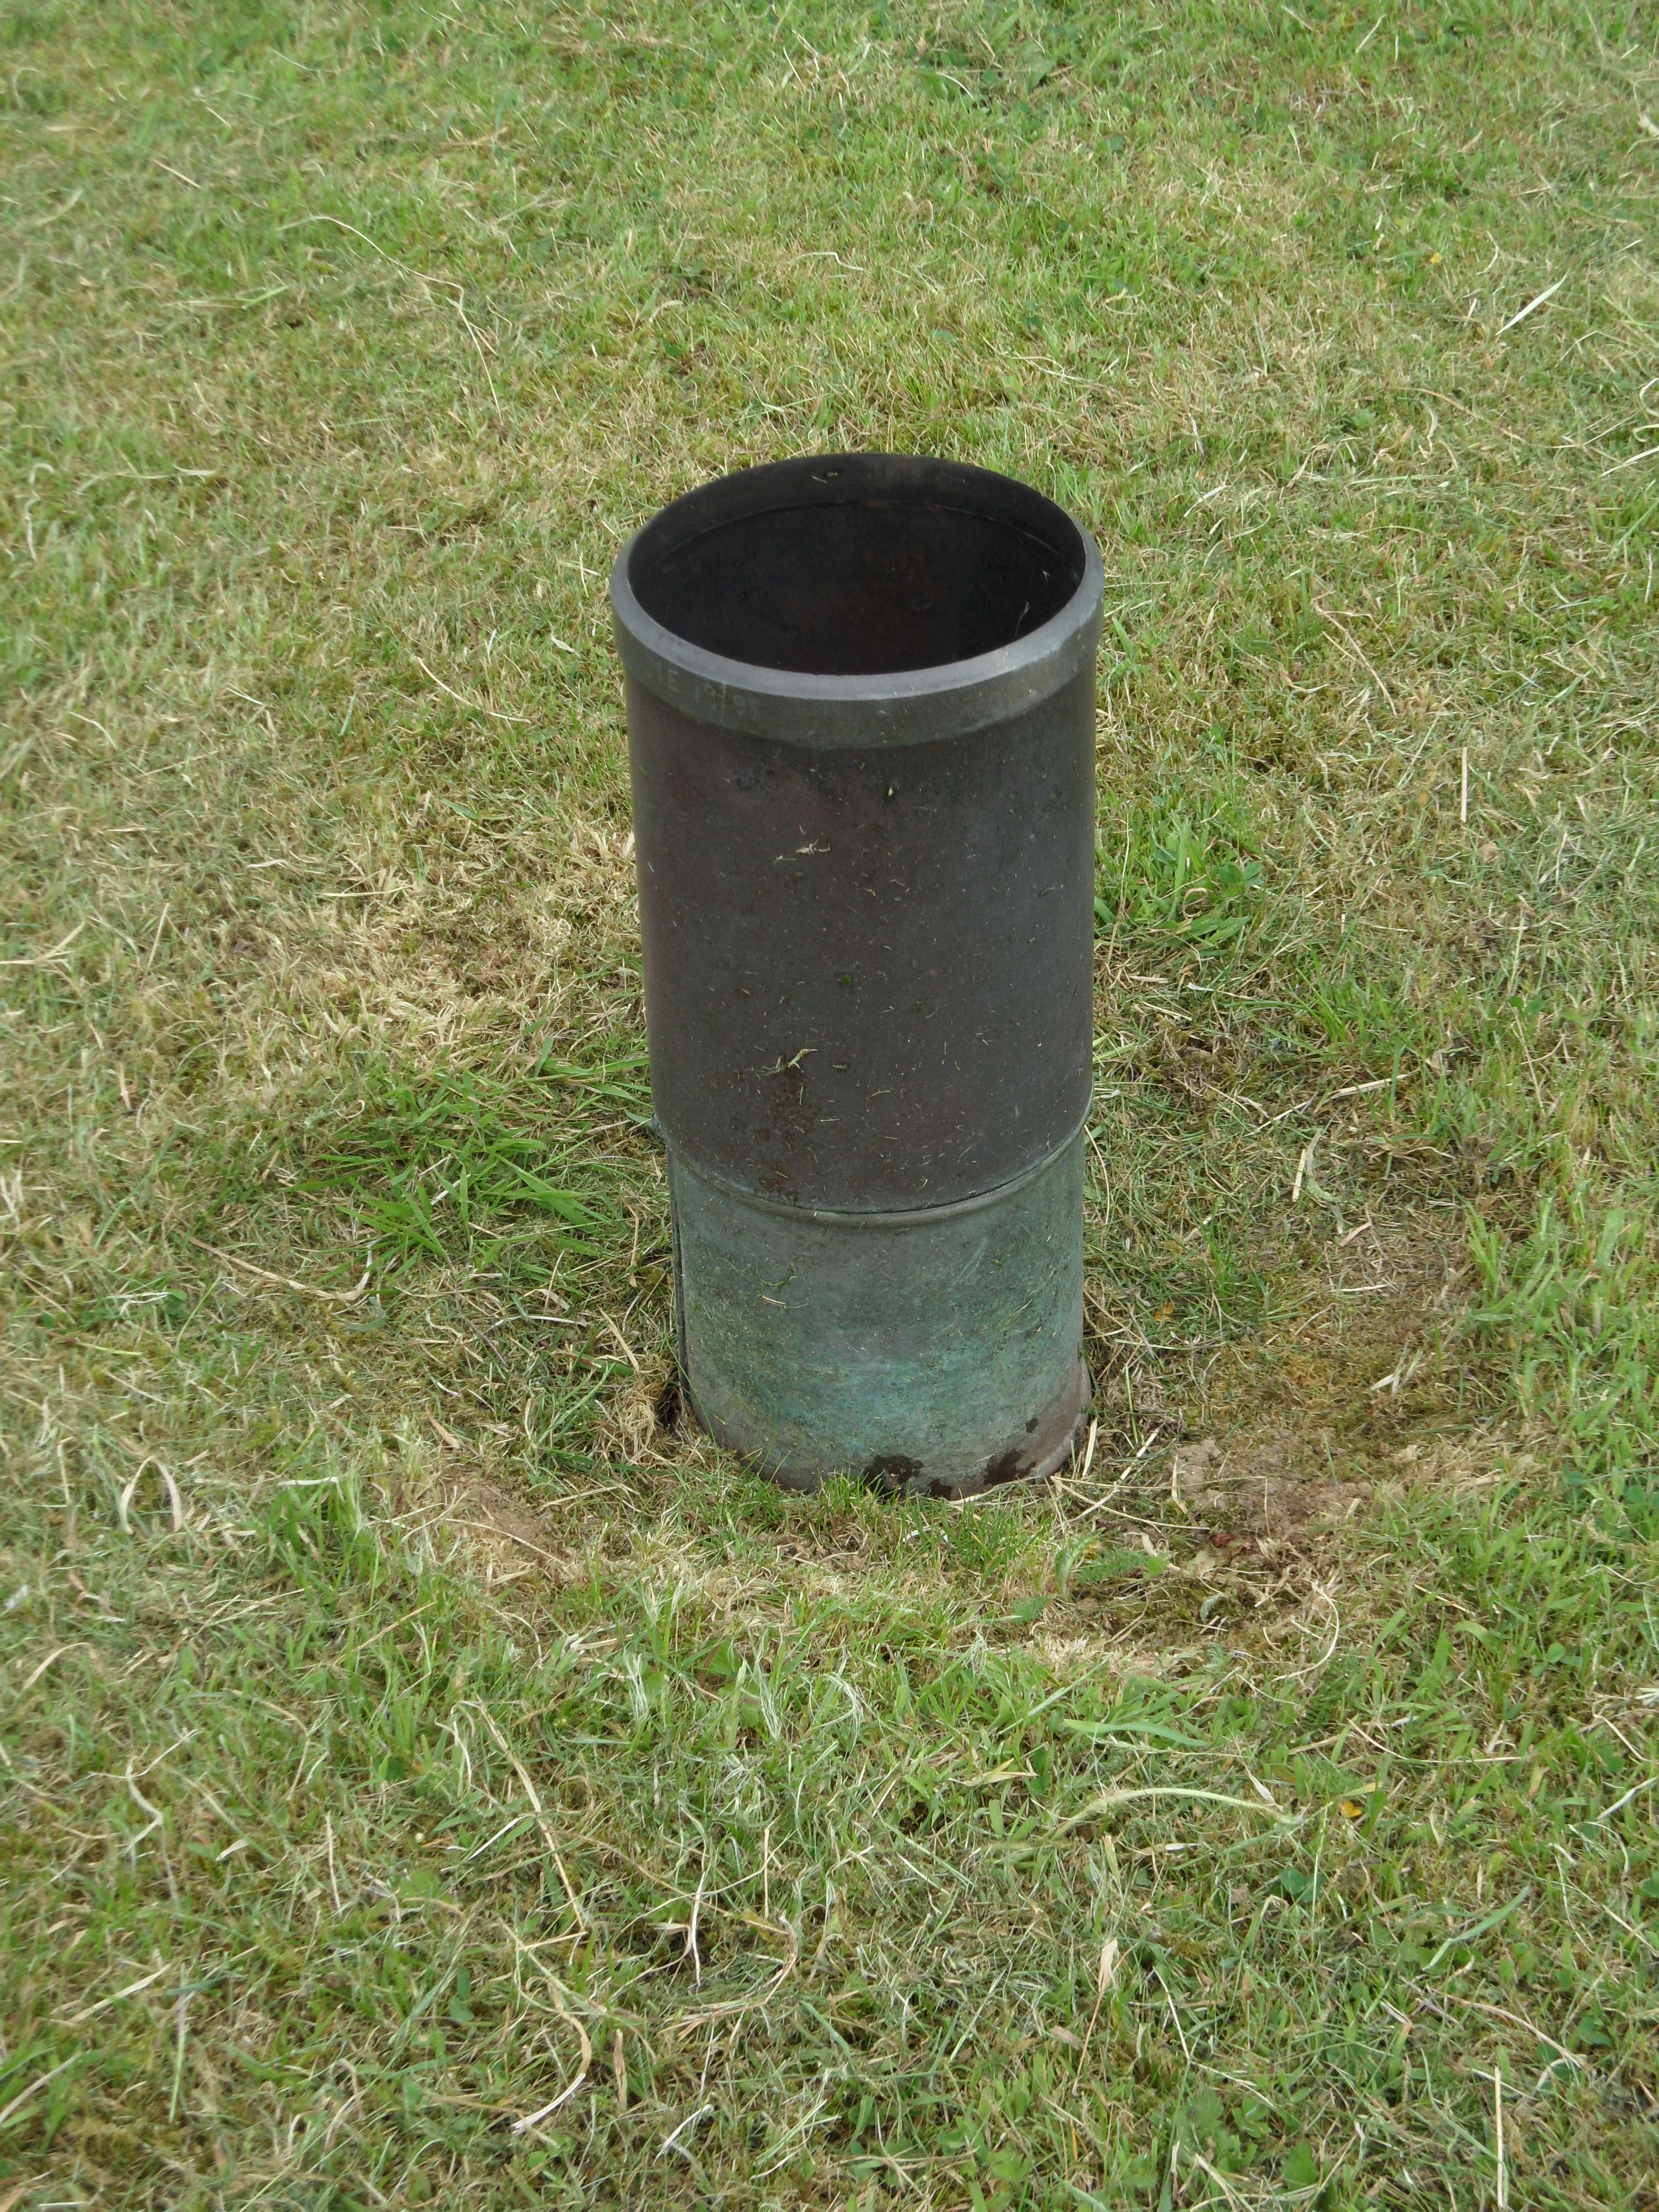
Historically rainfall was measured by rain gauges which collect rainfall falling into a funnel of upper diameter 127mm, 305mm above the ground, these are still used in the voluntary rainfall Network (inset image left: traditional rain gauge).
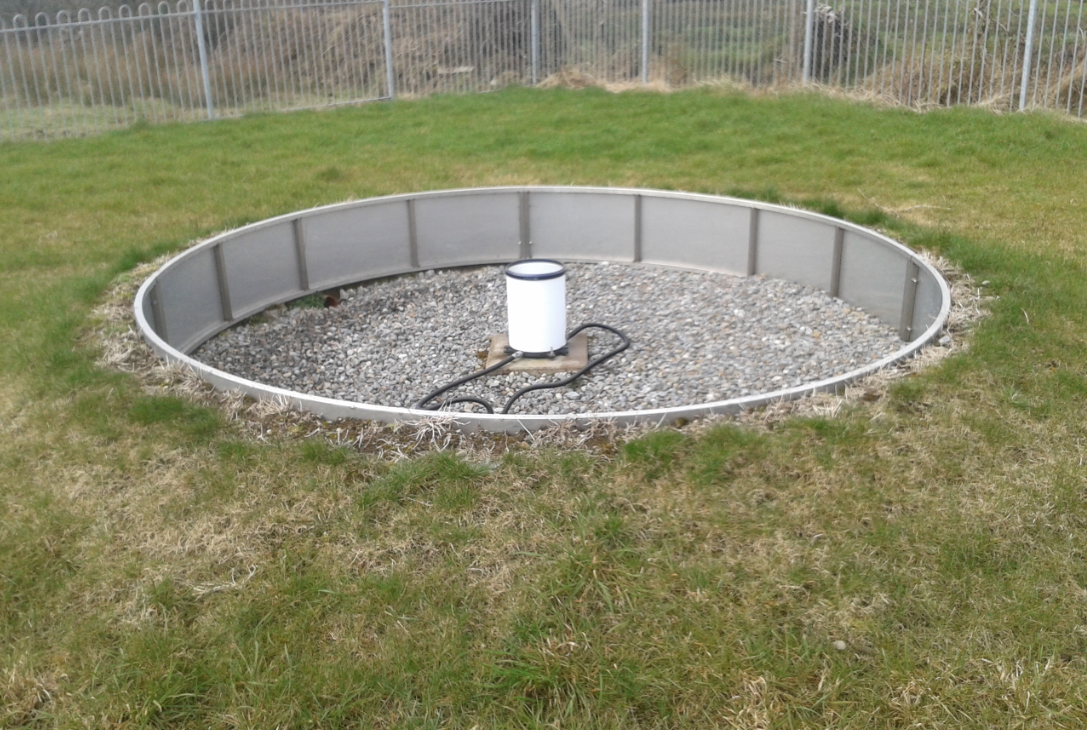
At synoptic stations, rainfall is measured by ‘tipping buckets’, these tip when 0.1 or 0.2mm of rain falls, and the number of tips is counted. The rain recorder is surrounded by a turf wall. (inset image right: tipping bucket rain gauge)
What is Driving Rain?
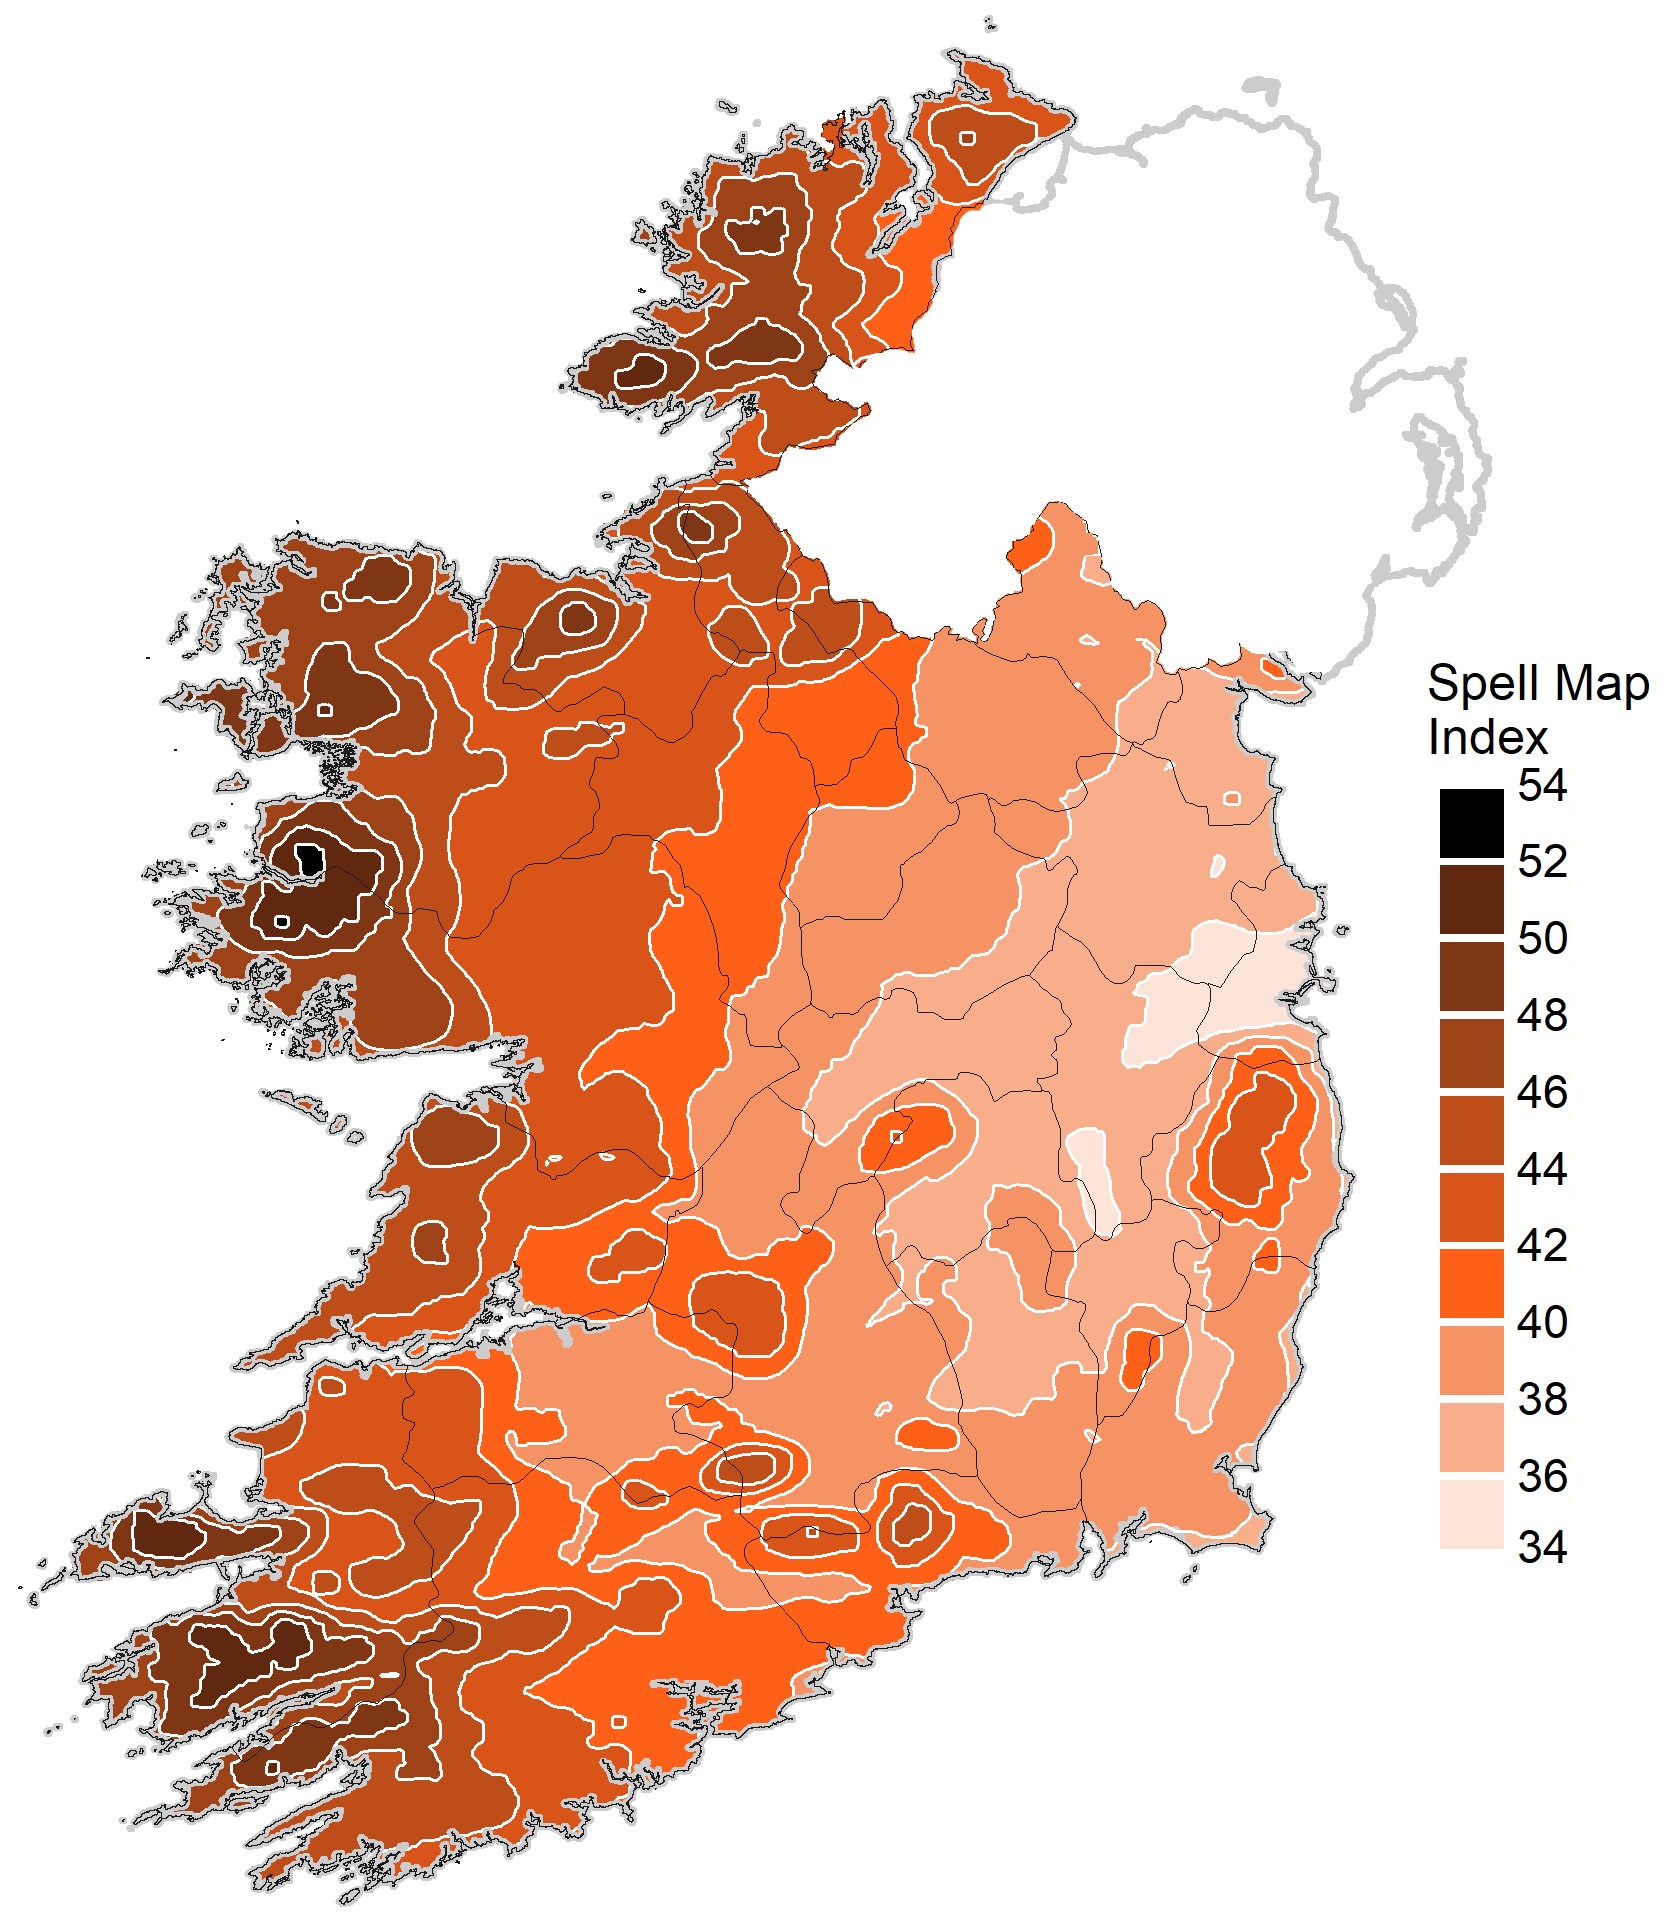
Spell map index (mS) of driving rain against vertical surfaces for the period 1991 – 2020 for Ireland (I.S. EN ISO 15927 32009).
Wind-driven rain against a wall may be partially absorbed or penetrate through cracks in the wall, therefore increasing the risk of damage to the building fabric. Rain penetration through gaps and cracks in building façades and around the edges of doors and windows usually occurs after short periods of heavy rainfall accompanied by winds. The impacts of rain on buildings depend on the rain intensity and duration, wind speed and wind direction.
For the first time, the map of Driving Rain Index for Vertical Surfaces according to I.S. EN ISO 15927-3:2009 and based on hourly data from the latest climate normal 1991 – 2020 has been produced by Met Éireann for use in building design to enhance resilience in support of climate change adaptation in Ireland. The new map supersedes the previous map published by Met Éireann in 2010 and 2023 and should be adopted by decision makers. It is hoped that the detailed explanation of the application of the I.S. EN ISO 15927-3:2009 methodology will be of assistance to regulators elsewhere in adopting this methodology in their own jurisdictions.
Read the full report:
Mateus, C., and Coonan, B. 2024. Distribution of driving rain in Ireland. Climatological Note No. 17. Met Éireann. http://hdl.handle.net/2262/101280
Rainfall Return Periods
Estimates of return levels of rainfall thresholds for specific return periods is often required by engineers, architects and others, usually in connection with the design criteria for drainage schemes, sewerage systems, bridges, gutters, and fluvial flood mitigation measures.
The depth-duration-frequency (DDF) model has been applied to calculate the return values of various rainfall durations ranging from 15 minutes to 24 hours and from 1 to 25 days for several return periods ranging from 2 to 120 years for any location in Ireland.
These estimates supersede those provided in Fitzgerald (2007).
Need to read more about the method used in the estimation of point rainfall frequencies?
Mateus, C., and Coonan, B. 2023. Estimation of point rainfall frequencies in Ireland. Technical Note No. 68. Met Éireann.
The Island of Ireland Precipitation Series 1850-2016
An Island of Ireland Precipitation (IIP) series covering the period 1850-2010 for 25 locations has been constructed by researchers at Maynooth University and Met Éireann. Such long-term series are critical for understanding past and emerging changes to the precipitation regime and the hydrological cycle. The resulting dataset provides the second-longest regional precipitation archive in the British and Ireland.
All rainfall data since 1941 has been digitised and is already available for analysis, data prior to 1941 for the most part is still in the original paper format. These early records are particularly valuable, but for the data to be used it must be ‘rescued’. Data rescue is the term used to describe the process of cataloguing, scanning and keying in data from old climate records to make it available for use. The data must be then undergo quality assurance, for example what type of instrument was used, what was the precise location and height of the recording, this type of information is known as metadata – or data about data, and is crucial to construction a homogenous climate time series. A homogeneous climate time series is defined as one where variability is only caused by changes in weather or climate, so any changes due to different types of instrument or changes in the location of the observation are identified and a correction is applied to the raw data, this process is known as homogenisation.
Another issue that must be addressed in constructing long time series is that many stations do not have continuous observations over long periods of time, to overcome this ‘bridging’ is undertaken. This is where times series are extended using observations from neighbouring ‘donor’ stations where a sufficiently long overlaps exist to allow a relationship be established between the target station and its neighbours, in this way gaps in a time series can be infilled.
A number of long term rainfall records (16) were available from the Climate Research Unit at the University of East Anglia, a long term data series from Armagh Observatory was provided by Professor John Butler. An additional eight stations were recovered from the archives at Met Éireann form archived precipitation records collected prior to 1941 and held in paper form and digitised records for selected stations (post 1940) as follows; firstly quality long term series are identified and the data for that station are rescued, then donor stations are identified for any gaps in the time series and the data for the donor stations is rescued, a mathematical relationship is derived between the long term station and the donors and this is used to infill an missing data.
The 25 time series is are now complete, but they must be homogenised to ensure that the values are a true reflection of the weather and climate without any artificial variations due to observational changes or bridging techniques. The homogenisation process involves three stages, first basic quality control of the data was carried out, second a software package called HOMER was applied to the time series to identify breaks by comparing with 12 neighbouring stations, of the breaks identified only supported by station metadata were adjusted in stage three, where the HOMER package is used to adjust the time series, and infill missing data back to 1850 if necessary.
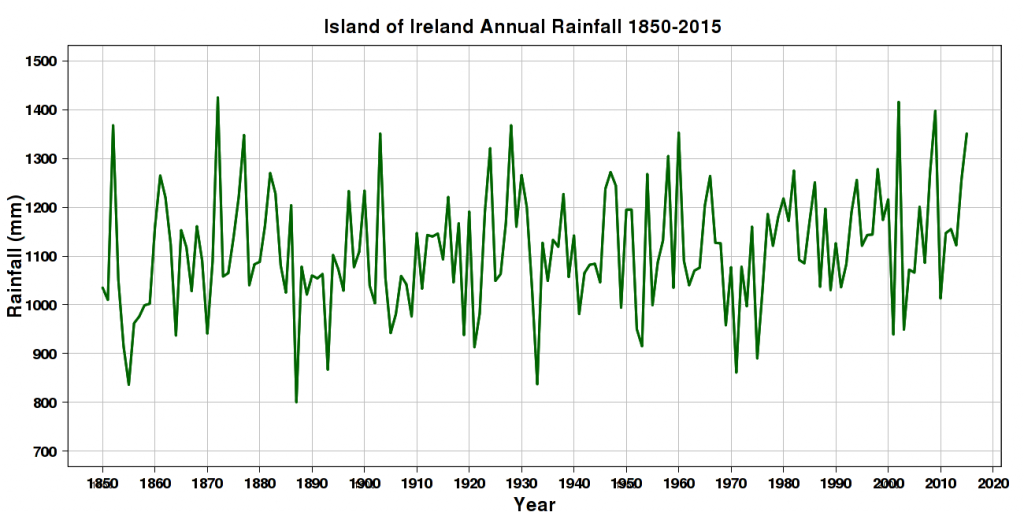
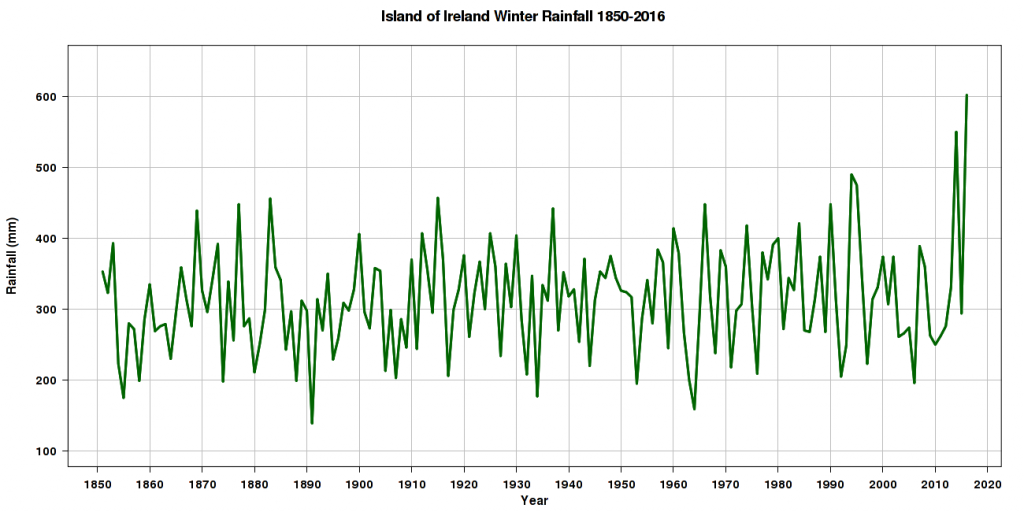
The expanded long-term monthly rainfall network for the Island of Ireland (1850-2010) is now available for analysis. This reveals positive (winter) and negative (summer) trends over the period 1850-2010. Trends in records covering the typical period of digitisation (1941 onwards) are not always representative of longer records, indicating the importance of long term records. The National annual rainfall times series for the Island of Ireland (25 station is shown in Figure 1. Since the original work was published, the lead author Simon Noone of Maynooth University has extended the times series to 2015 including winter of 2015/16. The winter rainfall series (December, January, February) from 1851 is shown in Figure 2 and clearly shows that winter 2015/16 was the wettest winter on records, followed by winter 2013/14, and that these two winter and the only winters where rainfall totals in excess of 500mm were recorded.
Download the homogenised and extended data for all 25 stations in the network, the Island of Ireland composite series and supporting metadata (in ZIP format).
Please cite the original paper if using this dataset: Noone, S., Murphy, C., Coll, J., Matthews, T., Mullan, D., Wilby, R. L. and Walsh, S. (2015), Homogenization and analysis of an expanded long-term monthly rainfall network for the Island of Ireland (1850–2010). Int. J. Climatol. doi: 10.1002/joc.4522
Climate Change and the Long Term Average (LTA) 1961-1990
The 1961-1990 LTA or ‘normal’ period is a fixed reference period used for climate change and variability studies. Data from rainfall stations are available in digital format from 1941, from these data gridded monthly rainfall totals have been produced for each month since January 1941. Below is the national annual rainfall time series, produced by averaging over all grid points for each year.
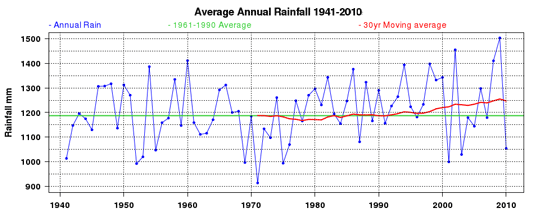
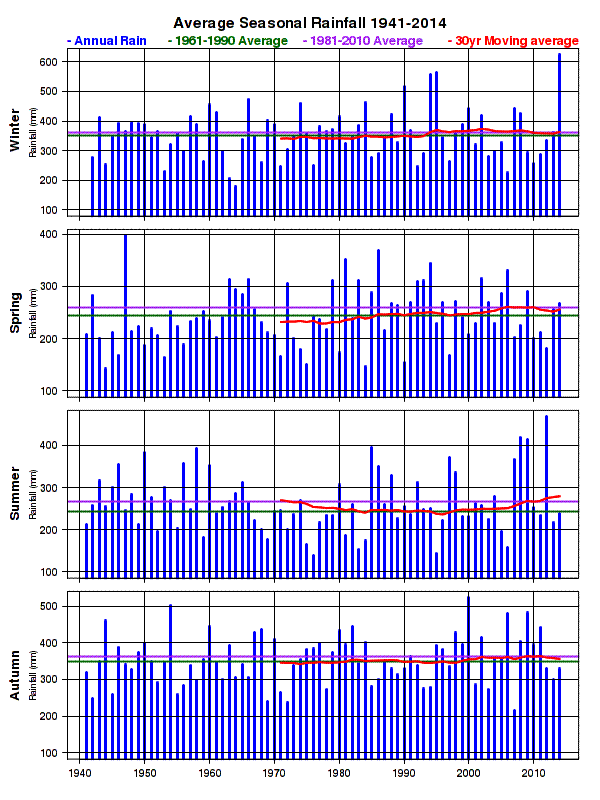
Below you will find a graph of the seasonal rainfall totals and difference from the 1961 to 1990 normals. Rainfall shows great year to year variability. A 30 year running mean of the national annual rainfall indicated an increase in average national rainfall of approximately 70mm over the last two decades. As with the annual totals of rainfall, all seasons show a small increase in totals over the last few decades.
What are the Meteorological Seasons?
An expert team of the World Meteorological Organisation has described a range of rainfall and temperature climate change indicators, to enable uniform comparison of these variables. In the case of rainfall, these indices include the number of wet days and rain days and the number of days with rain above certain thresholds.
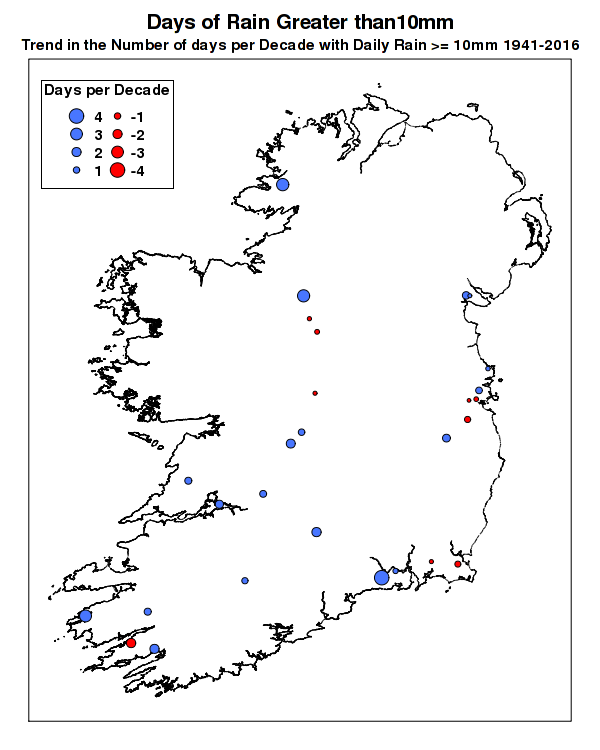
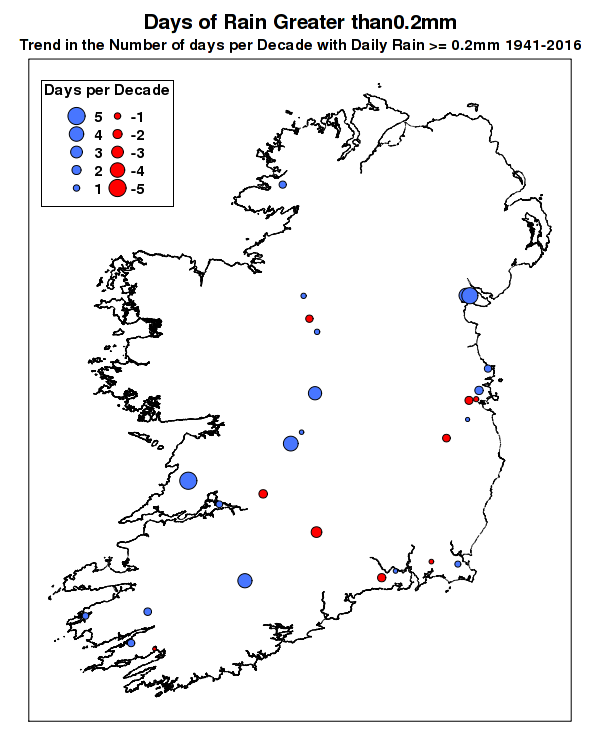
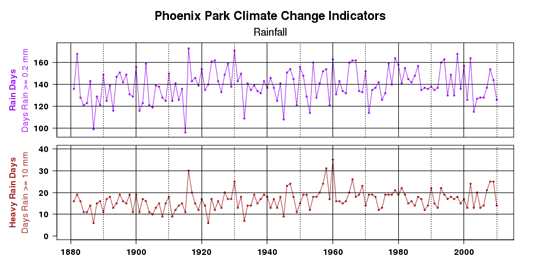
From individual station records, trends have been calculated for the indicators for stations which have a near-complete daily record for the 1961 to 2010 period. The trends for the number of days with daily rainfall greater than 10mm from 1961 to 2010 are shown above. The trends for rainfall do not show the same level of confidence as those for temperature, they show greater regional variation and occasionally conflicting trends from stations that are geographically relatively close.
The Current Rainfall Irish Climatology and the Long Term Average period 1991-2020
Link to dataset: 1991-2020 Rainfall Grid
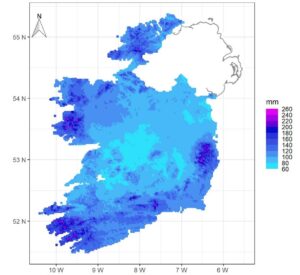
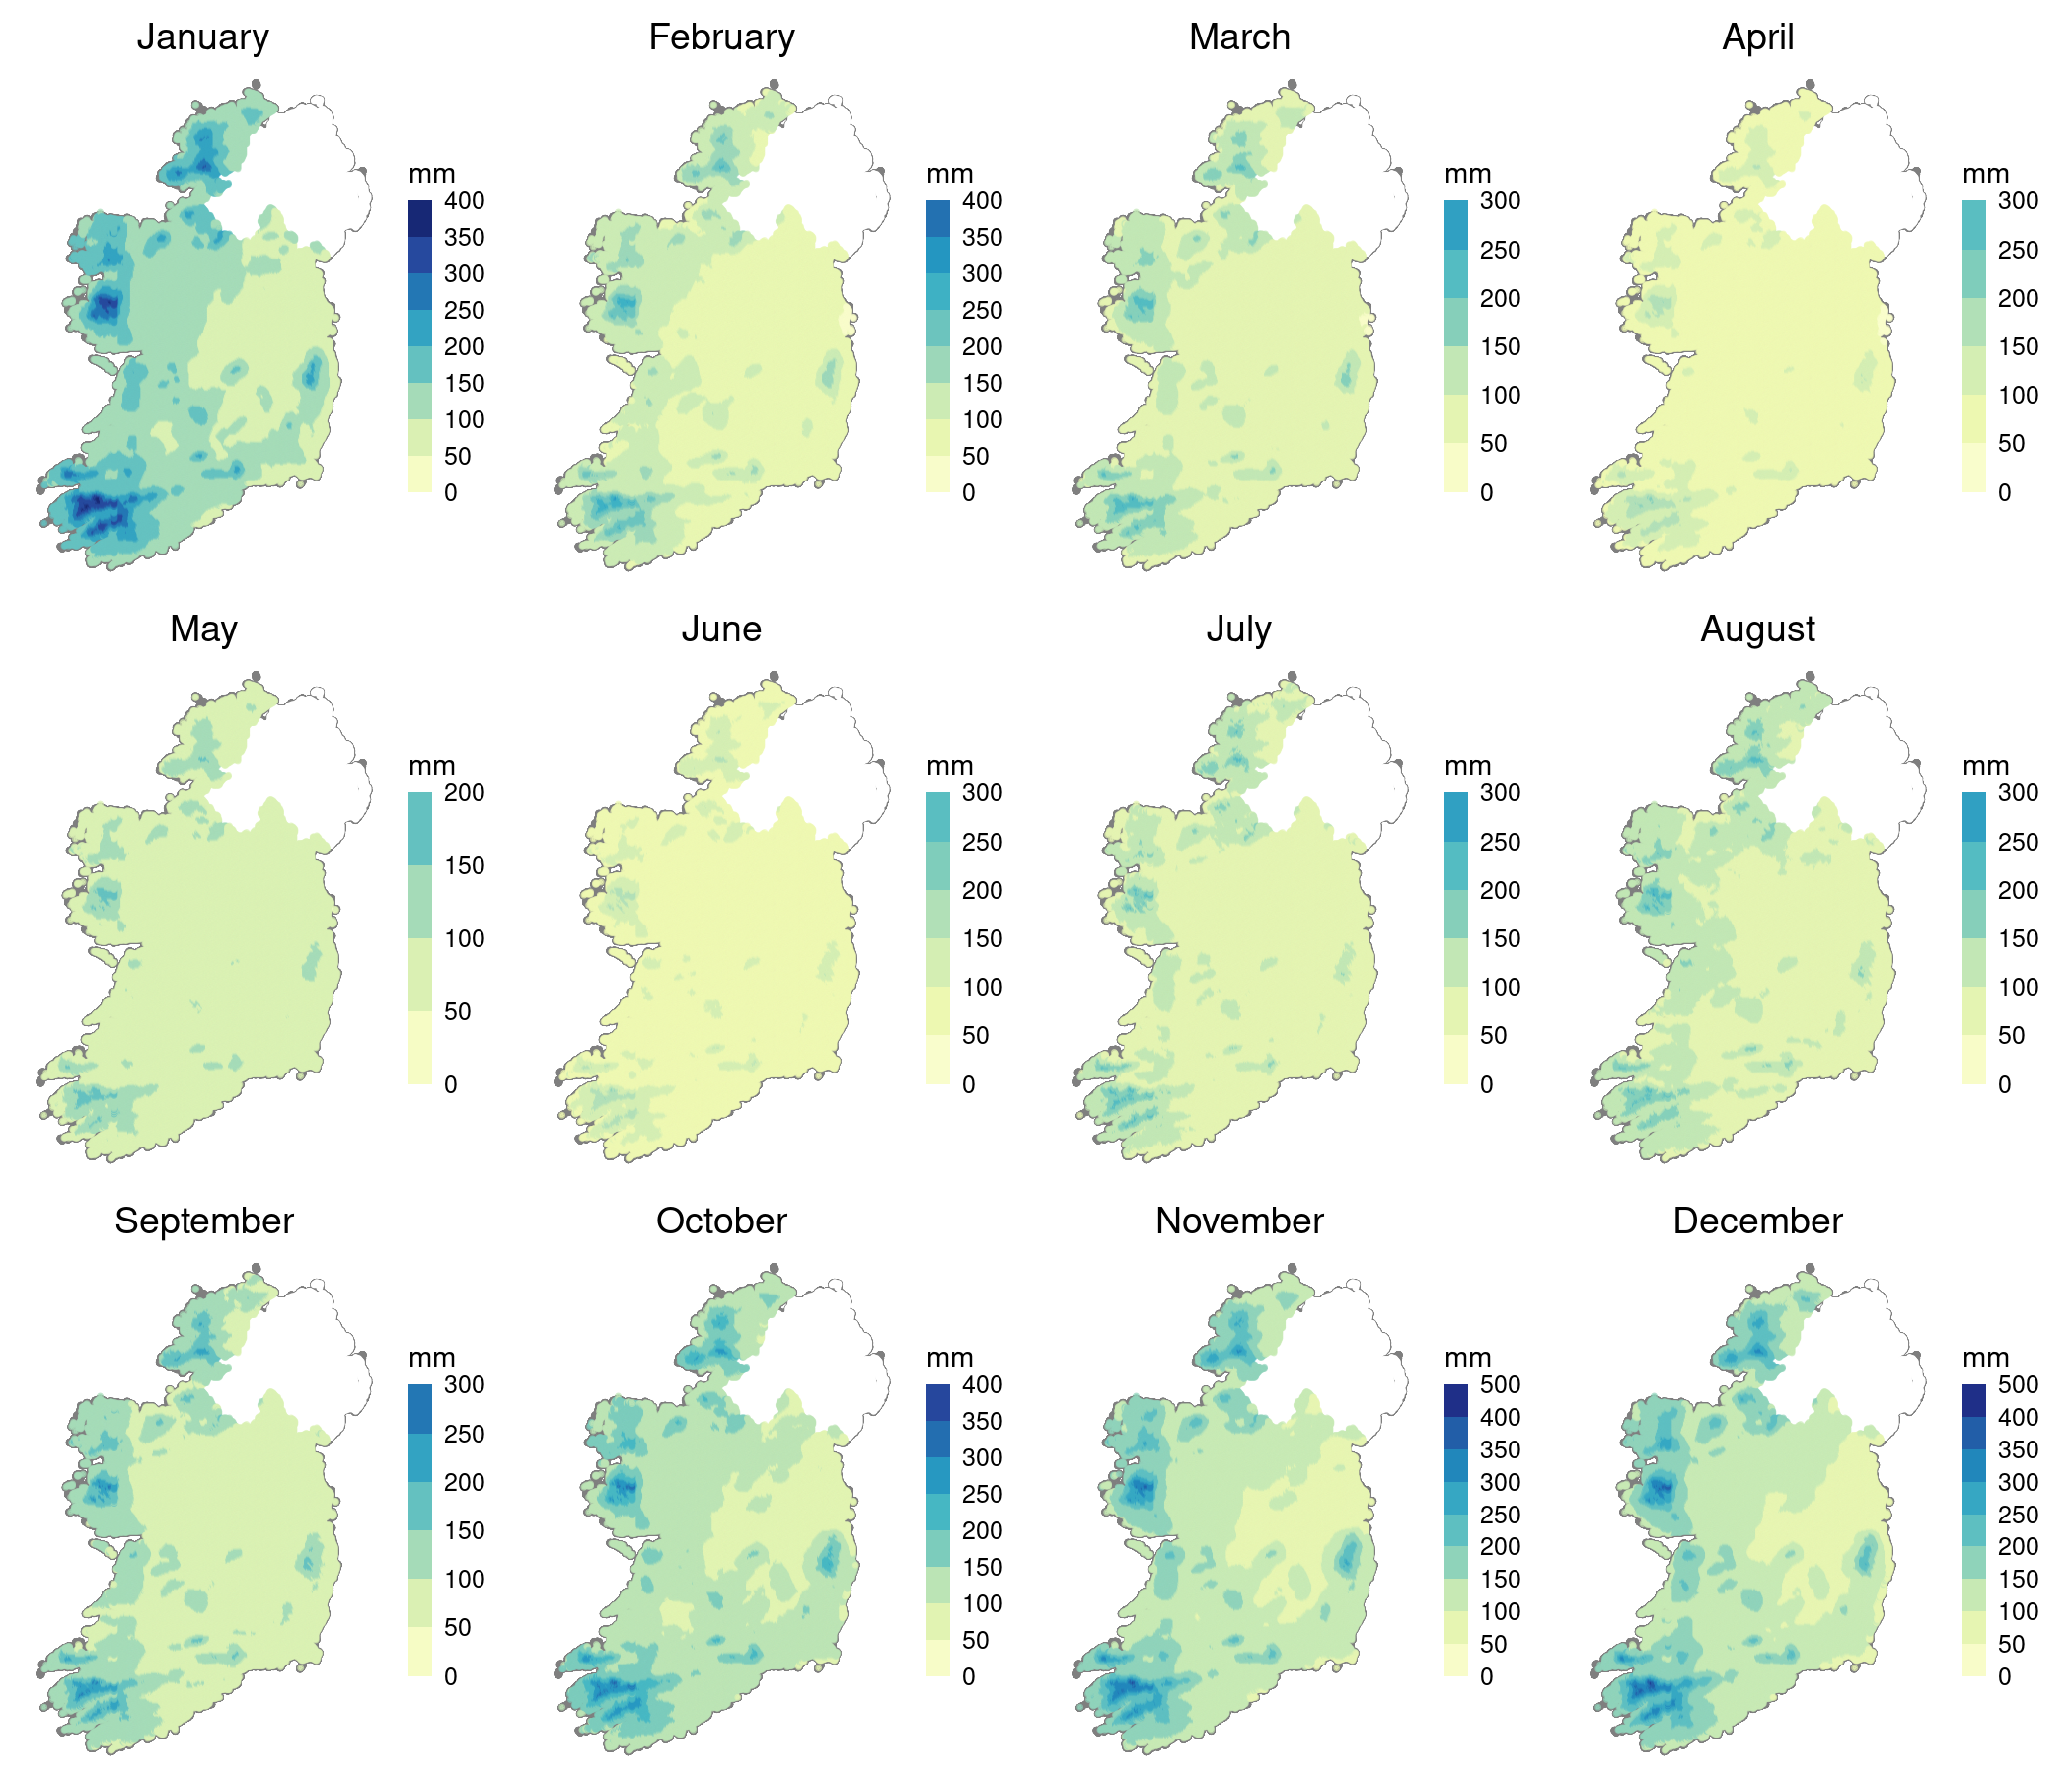
Long Term Averages or ‘normals’ are used for comparison purposes and to put values in context. The LTA 1991-2020 series is the period currently used for the climate periodicals (Statements, both final and provisional). Most of the eastern half of the country gets between 750 and 1000 (mm) of rainfall in the year. Rainfall in the west generally averages between 1000 and 1400 mm. In many mountainous districts rainfall exceeds 2000 mm per year.
The following maps show the average monthly rainfall accumulation (1991 to 2020). December is the wettest month with average rainfall of approx. 142 mm for the 1991-2020 period. Following December, the wettest months in the 30-year period are October, November and January with average rainfall amounts of approximately 130 – 140 mm. The driest months are April and May with average rainfall of 82 mm and 79 mm respectively. Hail and snow contribute relatively little to the precipitation measured.
See our 30-year averages page for more information on how rainfall is changing in Ireland.
