Cool and sunny. Dry in the North and West, wet in the South and East. Record breaking winds
- The average national temperature for January 2025 (using the Island of Ireland dataset*) was 5.37 °C, which is 0.45 °C below the most recent 1991-2020 long-term average (LTA) and 0.28 °C above the 1961-1990 LTA. January 2025 was the 66th warmest and 61st coldest January on record since 1900.
- The warmest January remains in 1916 (109 years ago) and the coldest January remains in 1963 (62 years ago). Four of the top ten warmest Januarys have occurred since 2005. One of the top ten coldest Januarys has occurred recently, that is 2010.
- Provisional gridded rainfall data suggests January 2024 averaged at 116.7 mm (88% of the 1991-2020 LTA).
- The wettest January was in 1974 (51 years ago) and the driest January was in 1963 (62 years ago).

January 2025 Climate Statistics
January 2025 was a cool month overall. Rainfall varied from dry in the North and Northwest to progressively wetter towards the South and East. Early in the month high pressure to the west allowed a cold arctic airmass to sink south over the country, which remained in place for the first third of the month. Low pressure to the southwest pushed weather fronts northwest into the cold airmass over Ireland and brought heavy snow to the south Midlands, South, Southwest and West on Saturday 4th and Sunday 5th, while the East saw heavy rain. The snow lingered on the ground for several days in places. High pressure developed to the southeast and brought milder, drier and cloudier conditions for second third of the month. The final third was dominated by a powerful Atlantic jet stream, which steered several active low pressure systems towards Western Europe. One low pressure system, named storm Éowyn by the Met Office (UK), went through explosive cyclogenesis as it approached Ireland from the southwest on Thursday 23rd and reached peak intensity as it brushed by the northwest coast of Ireland in the early hours of Friday 24th, with a sting jet feature forming on the south side of the low. This brought heavy rain and extreme winds across the country with widespread disruption and power outages. Another system, named storm Herminia by the Spanish national weather service (AEMET), became slow moving as it passed over the country between Sunday 26th and Tuesday 28th and brought further wet and windy spells. The month finished quieter, as pressure rose to the south.
Rainfall: Driest in the Northwest. Wettest in the South and East
The majority of monthly rainfall totals across the country were below their 1991-2020 Long-Term Average (LTA). The lowest monthly percentage rainfall was 47% (57.7 mm) of its LTA at Athenry, Co Galway. In contrast, the highest was 173% (165.3 mm) at Roches Point, Co Cork. Monthly rainfall totals ranged from 57.7 mm at Athenry, Co Galway to 198.8 mm (106% of its LTA) at Valentia Observatory, Co Kerry. The highest daily rainfall total was 37.4 mm at Valentia Observatory on Saturday 4th. Rain days* ranged from 13 days at Dublin Airport, Co Dublin to 27 days at Belmullet, Co Mayo. Wet days* varied from 9 days at Phoenix Park, Co Dublin to 22 days at Belmullet. Very wet days* ranged from zero days at Ballyhaise, Co Cavan to 8 days at Valentia Observatory, Co Kerry. A Dry spell*) was recorded at Phoenix Park, Co Dublin between Monday 6th and Wednesday 22nd (17 days). Johnstown Castle, Co Wexford had its wettest January since 1998 with 153.8 mm (152% of its LTA).
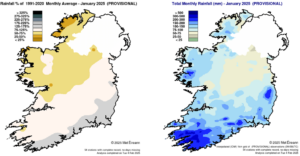
Rainfall % of 1991 – 2020 Monthly Average for January 2025 (Provisional) Total Monthly Rainfall (mm) for January 2025 (Provisional)
Temperature: Below average nearly everywhere
Overall, mean air temperatures were below their LTA for the month. Deviations from mean air temperatures ranged from -1.0 °C at Dublin Airport, Co Dublin (4.3 °C mean temperature) to +0.2 °C at Malin Head, Co Donegal (6.2 °C mean temperature). Mean temperatures for the month ranged from 3.9 °C (0.4°C below its LTA) at Knock Airport, Co Mayo to 7.3 °C (0.4°C below its LTA) at Sherkin Island, Co Cork. The month’s highest temperature was 14.2 °C recorded at Finner, Co Donegal on Monday 13th. The month’s lowest air temperature was -7.6 °C recorded at Athenry, Co Galway on Thursday 9th (the lowest temperature at a synoptic station since December 2022). The lowest grass minimum temperature was -11.8 °C reported at Mullingar, Co Westmeath on Thursday 9th. Nine stations reported an icing day* on Wednesday 8th. All stations reported ground frost during January. The number of days with ground frost ranged from 11 days at Mace Head, Co Galway and Valentia Observatory, Co Kerry to 25 days at Phoenix Park, Co Dublin. All stations reported air frost during January. The number of days with air frost ranged from 1 day at Malin Head, Co Donegal to 17 days at Athenry, Co Galway. Oak Park, Co Carlow (-6.7 °C) and Johnstown Castle, Co Wexford (-3.4 °C) had their lowest January minimum temperature since 2010.
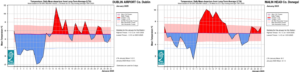
Dublin Airport, Co Dublin and Malin Head, Co Donegal: Temperature: Daily mean departure from LTA for January 2025 based on 09-09hr Max/Min values.
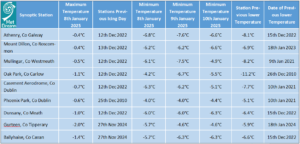
Maximum temperatures at the 9 stations that reported an icing day (where max daily temp < 0°C) on Wed 8th Jan 2025, plus the minimum temperatures at these stations during the cold spell in early January 2025.
Sunshine: Above average, sunniest in the East
All available sunshine totals were above their LTA. Percentage of monthly sunshine values ranged from 135% (71.1 hours) at Shannon Airport, Co Clare to 151% (81.1 hours) at Casement Aerodrome, Co Dublin (its sunniest January on record (length 61 years). Monthly sunshine totals ranged from 40.4 hours (no LTA comparison*) at Belmullet, Co Mayo to 89.7 hours (no LTA comparison*) at Dublin Airport, Co Dublin. The highest number of daily sunshine hours recorded this month was 8.0 hours at Johnstown Castle, Co Wexford on Friday 31st. The number of dull days* ranged from 10 days at Malin Head, Co Donegal to 14 days at Johnstown Castle, Co Wexford.
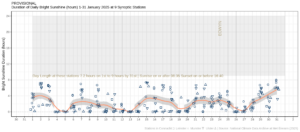
Hours of Bright Sunshine observed at nine stations for each day of the month of January 2025, grouped by province relative to the highest number of hours possible by end of month (shaded box).
Wind: Storm Éowyn brought hurricane force winds and new wind speed records for Ireland
- On Friday 24th January 2025 during storm Éowyn the provisional highest (sustained and gust) wind speeds in the digital climate record for Ireland were reported at Mace Head, Co Galway.
- The highest gust was 99.5 knots (184 km/h) while the highest 10-minute mean wind speed was 76.5 knots (142 km/h).
- Four stations broke their highest gust records. These were Mace Head, Co Galway, Finner, Co Donegal with 150 km/h (81 knots), Athenry, Co Galway with 139 km/h (75 knots) and Gurteen, Co Tipperary with 124 km/h (67 knots) (record lengths between 13 and 21 years).
- Four stations broke their highest 10-minute mean wind speed record. These were Mace Head, Co Galway, Finner, Co Donegal with 115 km/h (62 knots), Dunsany, Co Meath with 76 km/h (41 knots) (length 19 years) and Athenry with 83 km/h (45 knots).
- Two stations reached hurricane force 12 on the Beaufort wind scale.
- Four stations reached violent storm force 11 and eight station reached storm force 10 on the Beaufort wind scale.
Monthly mean wind speeds ranged from 5.5 knots (10.2 km/h) at Mount Dillon, Co Roscommon to 15.8 knots (29.3 km/h) at Malin Head, Co Donegal. Gales were reported on 10 days during the month with strong gales reported on 23rd, 24th, 26th and 27th. Mean wind speeds reached storm force at Roches Point, Co Cork late on Thursday 23rd and at seven other stations on Friday 24th during storm Éowyn. The seven other stations were Belmullet, Co Mayo, Knock Airport, Co Mayo, Mace Head, Co Galway, Finner, Co Donegal, Malin Head, Co Donegal, Shannon Airport, Co Clare and Sherkin Island, Co Cork. Mean wind speeds reached violent storm force 11 at Knock Airport, Co Mayo, Mace Head, Co Galway, Finner, Co Donegal and Malin Head, Co Donegal on Friday 24th during storm Éowyn. Mean wind speeds reached hurricane force 12 at Malin Head, Co Donegal and Mace Head, Co Galway on Friday 24th during storm Éowyn. The number of days with gales ranged from zero days at a few stations to 6 days at Roches Point, Co Cork. The number of days with up to strong gales ranged from zero days at a few stations to 3 days at Roche’s Point, Co Cork. The number of days with storm force winds were up to 2 days at Roche’s Point, Co Cork. Both the month’s highest gust and 10-minute mean wind speed was reported at Mace Head, Co Galway on Friday 24th during storm Éowyn. The highest gust was 99.5 knots (184 km/h) while the month’s highest 10-minute mean wind speed was 76.5 knots (142 km/h) (Ireland’s highest provisional (sustained and gust) wind speeds in the digital climate record). Several other station records for wind were broken during storm Éowyn. Highest gusts on record reported at Finner, Co Donegal with 150 km/h (81 knots), Athenry, Co Galway with 139 km/h (75 knots) and Gurteen, Co Tipperary with 124 km/h (67 knots) (record lengths between 13 and 16 years). Knock Airport and Mount Dillon, Co Roscommon tied their gust records. Highest 10-minute mean wind speeds on record were reported at Finner with 115 km/h (62 knots), Dunsany, Co Meath with 76 km/h (41 knots) (length 19 years) and Athenry with 83 km/h (45 knots).
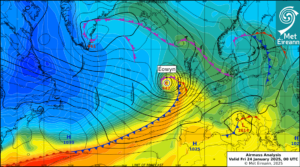
Airmass Analysis chart 00 UTC 24 January 2025: Storm Éowyn brought hurricane force winds.
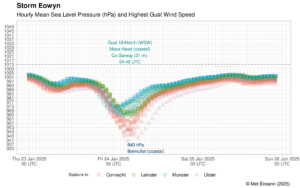
Hourly mean sea level pressure at synoptic stations (hPa) during the passage of storm Éowyn.
The full report is available here.
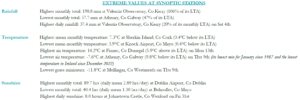
Extreme values for January 2025 at synoptic stations
*Issued by Met Éireann on Wednesday 5th February 2025. This report is based on available preliminary data from 25 principal weather stations operated by Met Éireann. Synoptic station data is midnight to midnight UTC. Long-Term Averages (LTAs) and “average” refer to the period 1991-2020 unless stated. A rain day is a day on which 0.2 mm or more of rainfall is measured. A wet day is a day with 1.0 mm or more of rainfall. A dull day is a day with less than 0.5 hours of sunshine. A very wet day is a day with 10.0 mm or more of rainfall. Climatological dry periods – An absolute drought is a period of 15 or more consecutive days to none of which is credited 0.2 mm or more of precipitation. A partial drought is a period of at least 29 consecutive days, the mean daily rainfall of which does not exceed 0.2 mm. A dry spell is a period of 15 or more consecutive days to none of which is credited 1.0 mm or more of precipitation (i.e. daily tot < 1.0 mm). A heatwave occurs where there are 5 consecutive days or more with maximum temperature over 25°C (that is, a daily maximum screen air temperature > 25° C). The ‘Island of Ireland’ dataset is 125 years long and runs between 1900 and 2023. For this dataset the long term averages from the 1961-1990 reference period are used for comparison as is standard for long-term climate change assessments. *Sunshine data is from the Autosol Network. LTAs for these sites are currently not used for comparison purposes. For more information, contact Met Éireann at 01-8064200 or e-mail: enq@met.ie